Run Reports
Open and run published reports on demand from the server.
AcuGIS Report Server is a self-hosted reporting platform for running, managing, scheduling, and distributing reports from your databases and GIS infrastructure.
Need to create reports? Explore Report Designer
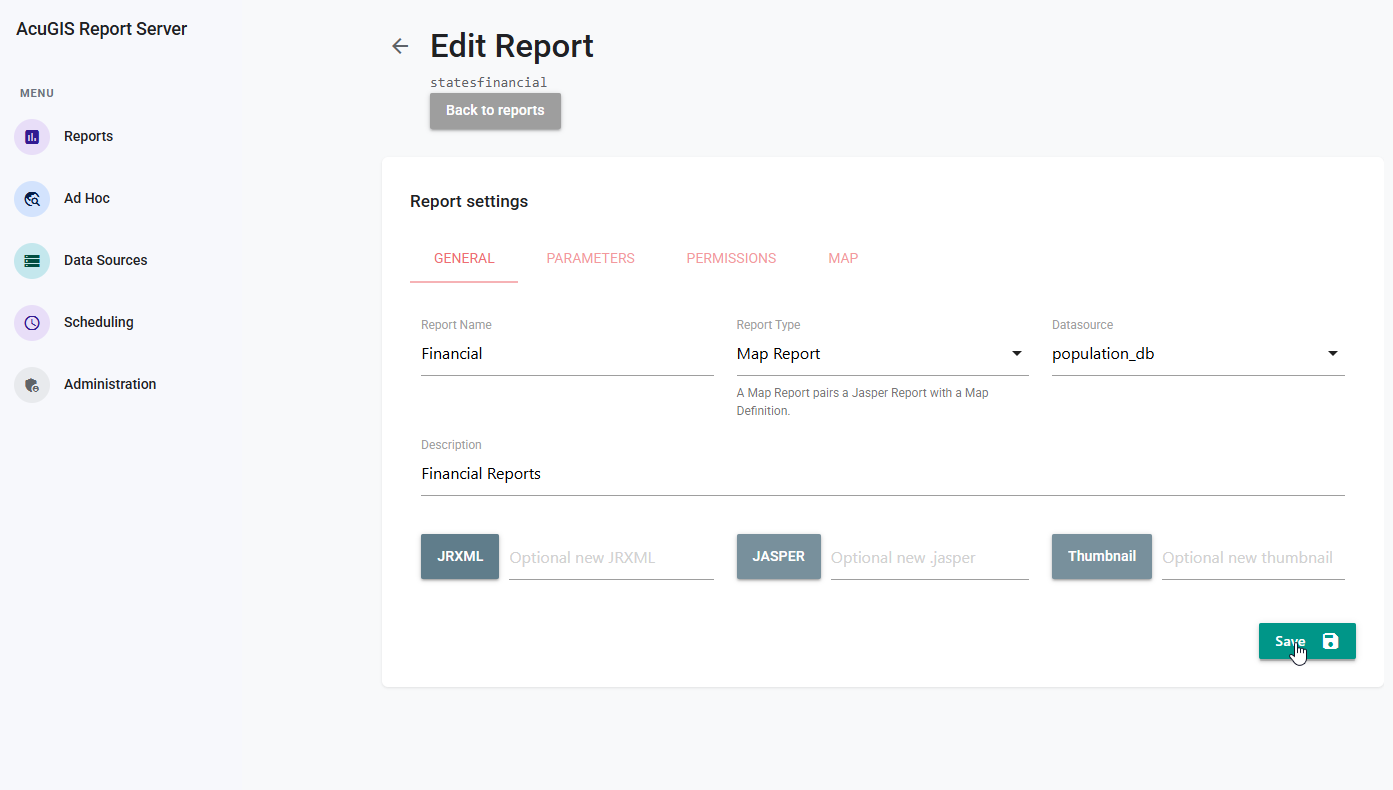
Report Server is where published reports are executed, secured, scheduled, and shared.
Open and run published reports on demand from the server.
Organize reports and resources in folders your team can browse.
Share HTML reports and let people open them in a browser.
Manage shared data sources used when reports run on the server.
Prompt for report parameters when a report is run.
Control access with users, groups, and permissions.
Schedule report runs instead of starting each one by hand.
Deliver scheduled reports by email.
Administer the server, including audit logs on Enterprise.
Connect to the databases and file formats your organization already uses.








Work with the GIS servers, standards, and spatial formats you rely on.





Use the server API and command line for the same reporting platform you run yourself. These are Report Server capabilities, not Designer editions.
Automate Report Server from your own applications. OpenAPI documentation ships with the server, along with Python, .NET, JavaScript, and Java SDKs.
Automate Report Server tasks from scripts and operations workflows on the host.
Bring reports, dashboards, charts, and maps into the applications your users already use.
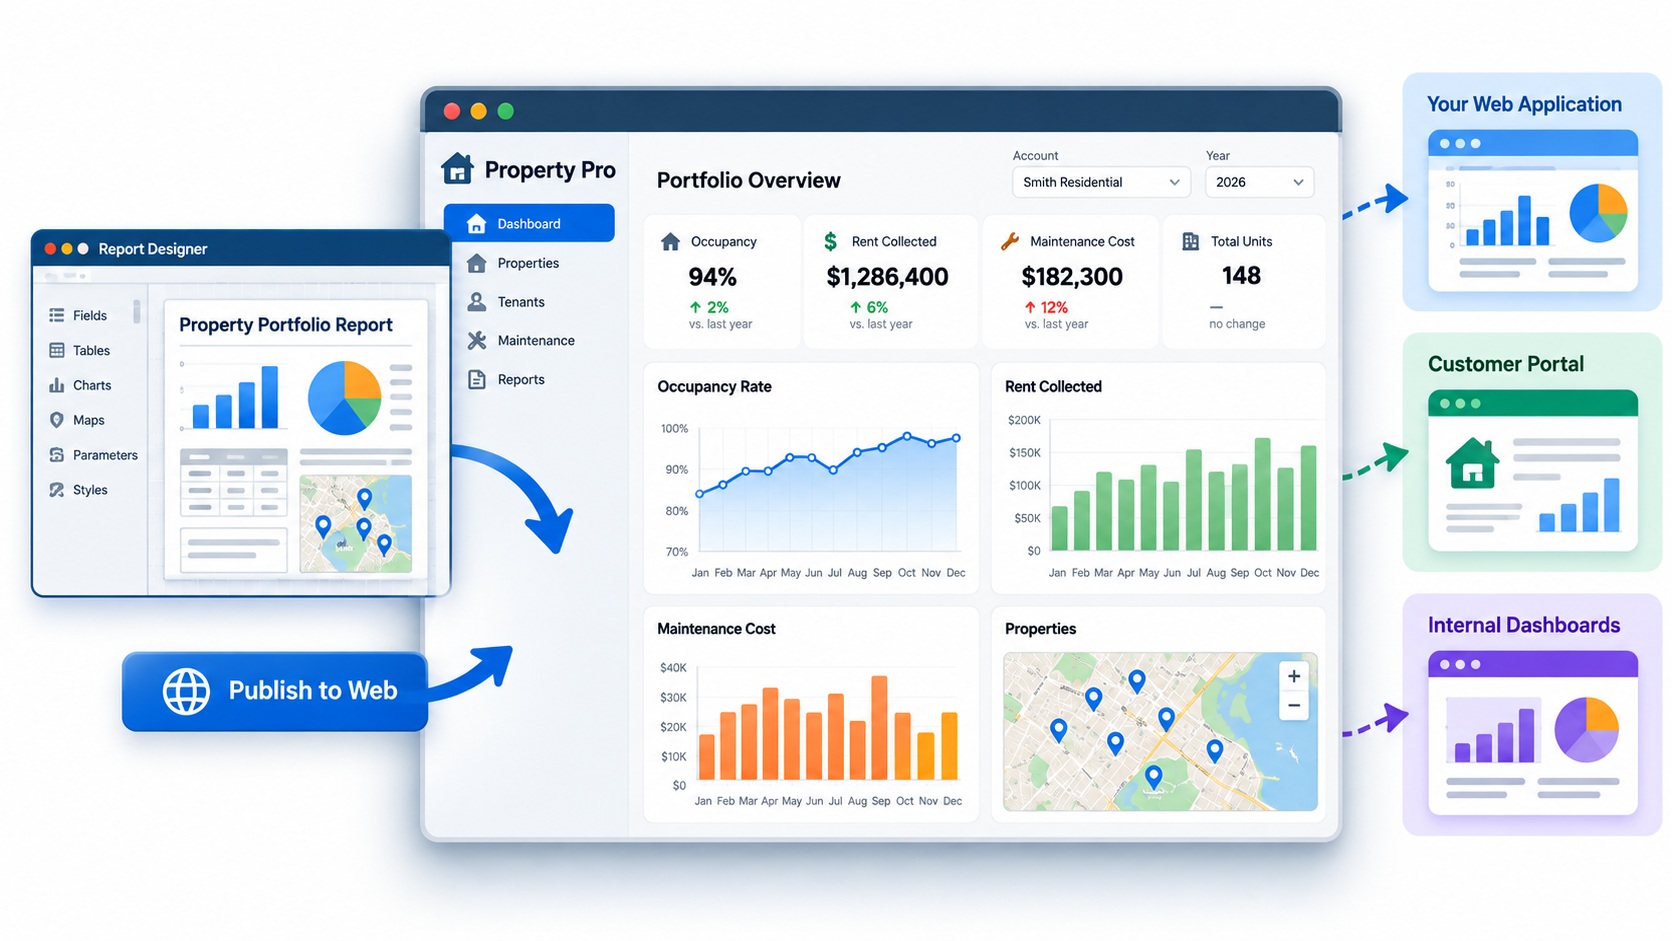
Publish reporting inside customer portals, internal applications, and other web experiences. Reporting stays on Report Server.
Report Server Professional
Connect compatible AI clients to governed report datasets. Report Server remains the security boundary.
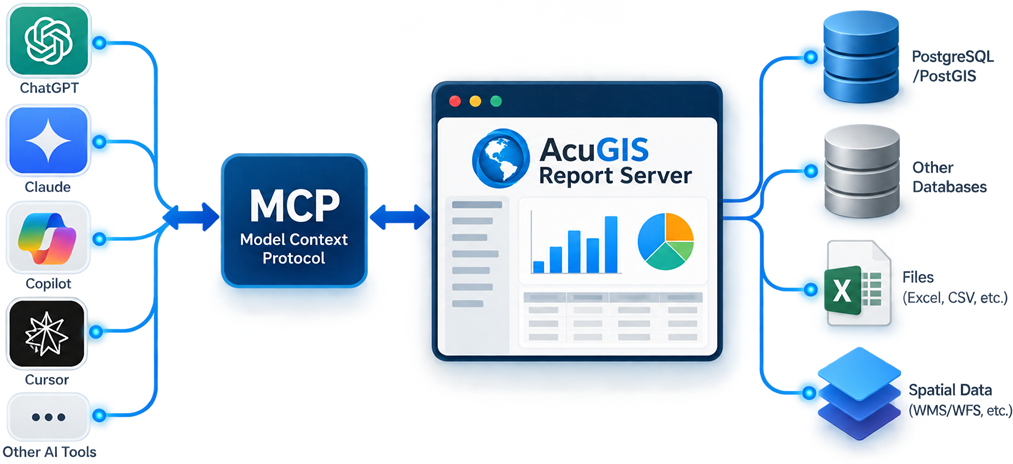
AI clients discover and query data the authenticated user is already permitted to access. They do not receive database credentials or arbitrary SQL access.
Start with Community or choose Enterprise for advanced analytics, automation, security, and governance.
| Feature |
Community
Free
Core reporting & publishing
|
Enterprise
Commercial
Advanced analytics & enterprise features
|
|---|---|---|
| Core Reporting | ||
| Report Server | check_circle | check_circle |
| Publish Reports | check_circle | check_circle |
| Report Parameters | check_circle | check_circle |
| PDF Export | check_circle | check_circle |
| HTML Reports | check_circle | check_circle |
| Automation | ||
| Report Scheduling | check_circle | check_circle |
| Email Delivery | check_circle | check_circle |
| Developer | ||
| REST API | check_circle | check_circle |
| OpenAPI / API docs | check_circle | check_circle |
| CLI | check_circle | check_circle |
| Python, .NET, JS, and Java SDK | check_circle | check_circle |
| Security & Access | ||
| Permissions | check_circle | check_circle |
| Groups | check_circle | check_circle |
| SSO / LDAP / SAML | close | check_circle |
| Maps | ||
| Embed Maps | check_circle | check_circle |
| Report Designer Maps | check_circle | check_circle |
| Map Reports | close | check_circle |
| Analytics | ||
| Dashboards | close | check_circle |
| Data Explorer | close | check_circle |
| Embedded Analytics | ||
| Embed JS SDK | close | check_circle |
| Secure Embed Tokens | close | check_circle |
| SSO-aware embedding | close | check_circle |
| Administration | ||
| Audit Logs | close | check_circle |
| Uage Analytics | close | check_circle |
| Governance / Certification | close | check_circle |
| SIEM / Audit Export | close | check_circle |
| Support | ||
| Support | Community | Ticket |
| Download Community | Contact Sales | |
Community is free to download and self-host. Enterprise includes advanced analytics, automation, security, and administrative capabilities.
Download the Open Source edition, evaluate Commercial on your own infrastructure, or let AcuGIS host and manage it for you.
| Option |
Open Source
Free
Self-hosted
|
Commercial
$699/yr
Full Commercial edition · Self-hosted
|
AcuGIS Managed
From $99/mo
Commercial edition · Fully managed
|
|---|---|---|---|
| Licensing & Hosting | |||
| Edition | Open Source | Commercial | Commercial |
| Hosting | Self-hosted | Self-hosted | Hosted by AcuGIS |
| Infrastructure | You provide | You provide | Included |
| Trial | Not required | 30 days | close |
| Users | Unlimited | Unlimited | Unlimited |
| CPU / Cores | No Limit | No Limit | Plan Resources |
| License Basis | Open Source | Annual | Monthly Service |
| Operations | |||
| Installation | Self-service | Self-service | Fully managed |
| Updates | Manual | Manual | Automatic |
| Backups | Self-managed | Self-managed | Managed backups |
| Monitoring | Self-managed | Self-managed | 24/7 monitoring |
| HTTPS / TLS | Self-configured | Self-configured | Included |
| Support | |||
| Support | Community | Ticket during trial | Ticket support |
| Commitment | None | 30-day evaluation | Monthly |
| Download Free | Start Free Trial | Get Managed | |
Commercial trials run on your own infrastructure. AcuGIS Managed is paid from the start and includes hosting, maintenance, backups, monitoring, and Commercial Report Server features.
Questions about Report Server, deployment, Professional licensing, or managed hosting?